Energy management

Capitals:
GRI:
sdgs:

Energy KPIs

Indicator calculations are based on the power generation assets of the ORLEN Group. Major assets by country:

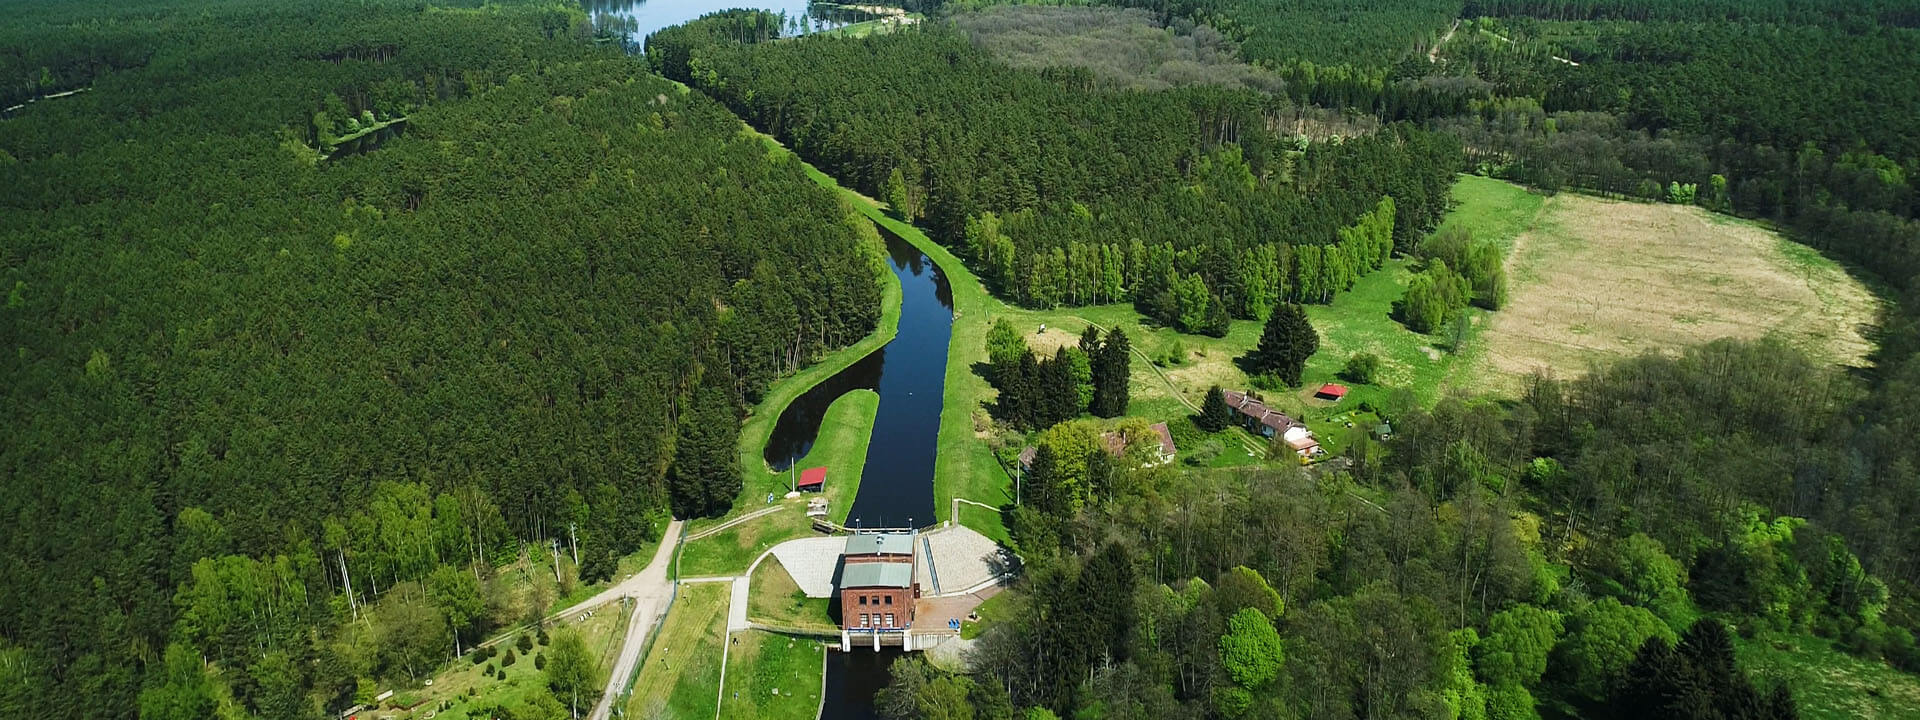
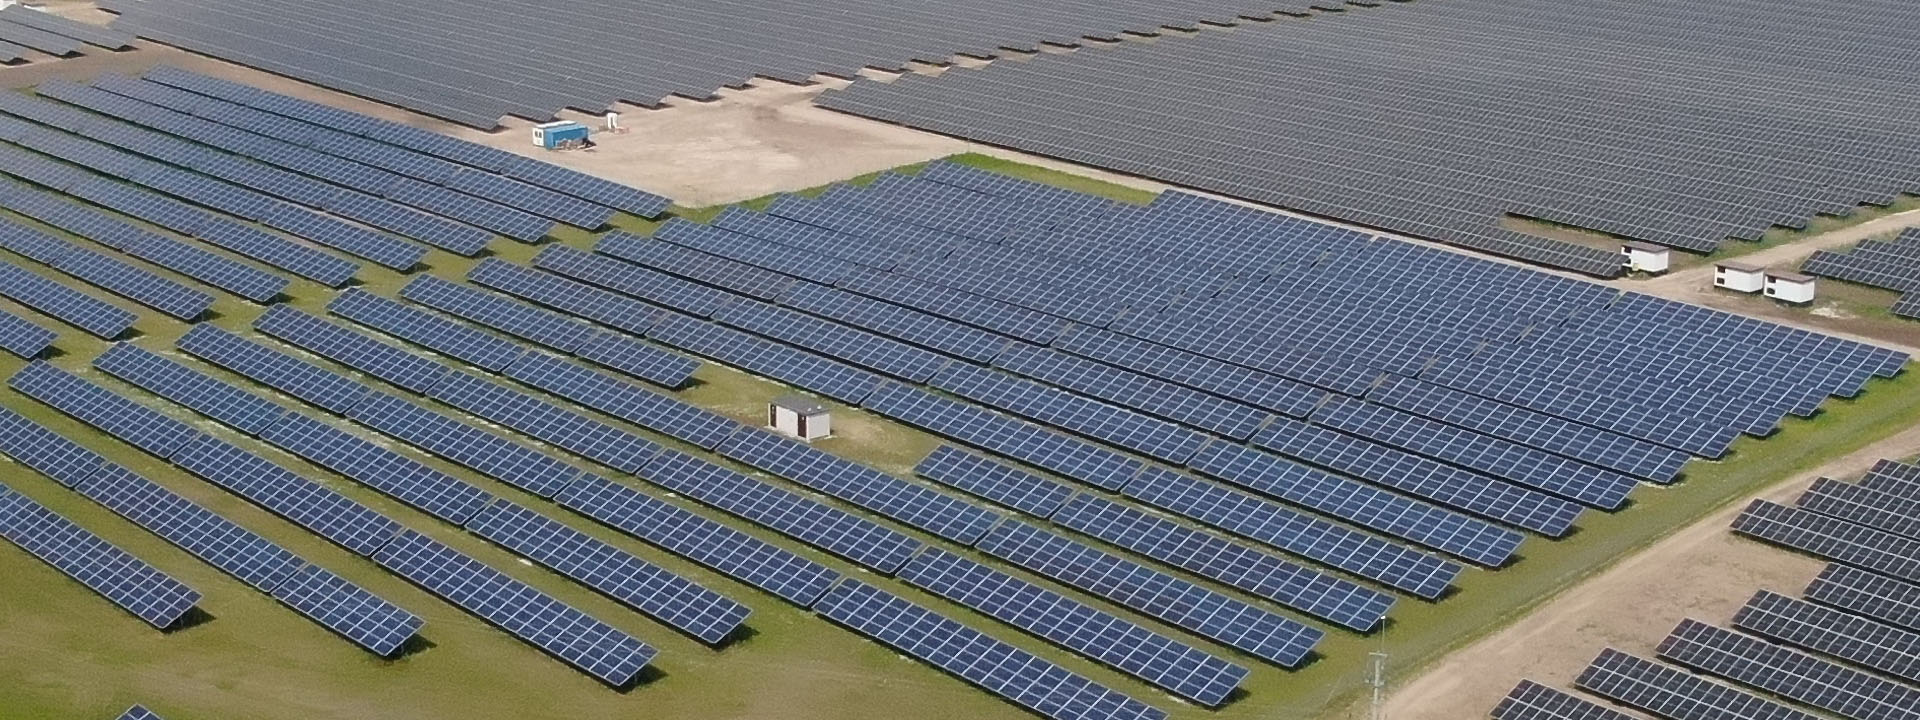
  • Poland: ORLEN’s CHP plant in Płock, CCGT unit in Płock and CCGT unit in Włocławek; ANWIL’s CHP plant; ORLEN Południe’s CHP plant in Trzebinia and CHP plant in Jedlicze; Energa Group’s generating units, including Ostrołęka Power Plant B, renewable energy sources (hydroelectric power plants, wind farms, solar power plants). The list of generation assets was expanded in 2022 to include the units operated by the LOTOS Group and PGNiG companies merged into the ORLEN Group, namely the CHP plants of Rafineria Gdańska and Energobaltic, and generating units owned by the Termika Group.
  • Lithuania: CHP plant in Mažeikiai;
  • Czech Republic: ORLEN Unipetrol Group’s generating units

The 2022 data for the ORLEN Group covers the full year, except for the former LOTOS Group and the former PGNiG Group, in respect of which the 2022 data covers the period from August 1st and from November 2nd to December 31st 2022, respectively, which are the dates when the two companies joined the ORLEN Group.

For selected indicators, full-year 2022 data is presented for the relevant companies of the PGNiG TERMIKA Group and the LOTOS Group. 2021 data for the ORLEN Group includes assets owned by the Group as at December 31st 2021.

  • 11.1.2

Energy consumption within the organisation, including fuel types used

The indicator was calculated as the difference between total chemical energy input of fuels, generation from renewable sources for which fuel consumption cannot be determined (solar, hydro and wind) plus energy purchased from the ORLEN Group’s third-party suppliers and sales of electricity, heat and cooling to customers outside the ORLEN Group.

Energy consumption at ORLEN Group by type of energy source

Energy consumption at ORLEN by type of energy source

Maximum achievable capacity, broken down by primary energy source 

Provided below are maximum gross generating capacities (which are not equivalent to the sources’ installed capacities).

Maximum achievable capacity at the ORLEN Group, broken down by primary energy source

Maximum achievable capacity at ORLEN, broken down by primary energy source

Provided below is the ‘Maximum achievable capacity by primary energy source’ indicator for the Termika Group and the former LOTOS Group for the full year 2022.

Net energy output broken down by primary energy source

The indicator is calculated as net energy output broken down by primary energy source.

Net energy output at the ORLEN Group, broken down by primary energy source

Net energy output at ORLEN, broken down by primary energy source

Provided below is the ‘Net energy output at ORLEN broken down by primary energy source’ indicator for the Termika Group and the former LOTOS Group for the full year 2022.

Average generation efficiency of CHP plants by energy source and regulatory requirements

The total generation efficiency was calculated as the quotient of total net energy output and the volume of fuel supplied, broken down by primary energy source. The electricity generation efficiency was calculated as net electricity output divided by the volume of fuel supplied for electricity generation (in the case of cogeneration units, established based on the physical division, i.e., in proportion to the energy volumes generated), broken down by primary energy source.

Average generation efficiency of CHP plants by energy source

Total investments in renewable energy

Energy sold by source

Provided below is the ‘Energy sold by source’ indicator for the Termika Group and the former LOTOS Group for the full year 2022.

Net energy output from renewable energy sources

The indicator includes electricity produced by wind, solar, biomass-fired and biogas-fired sources and hydroelectric power plants. Production from the Żydowo pumped-storage power plant has not been included.

Provided below is the ‘Net energy output from renewable energy sources’ indicator for the Termika Group and the former LOTOS Group for the full year 2022.

  • 11.1.8

The key indicator for the ORLEN Group's greenhouse gas (GHG) emissions is Net Carbon Intensity (NCI), which shows carbon intensity per unit of energy sold (gCO2e/MJ).

Its calculation accounts for all direct emissions (Scope 1), emissions related to the purchase of energy and heat for own use (Scope 2), and indirect emissions resulting from the use of products sold (Scope 3, Category 11). The numerator excludes volumes of carbon dioxide captured using CCUS technologies, both at the Group’s assets and as part of services provided to third parties. Energy content of products sold comprises sales of traditional fuels (diesel oil, gasoline, gas, etc.), low- and zero-carbon fuels (biofuels, hydrogen, biogas, etc.), electricity and heat. Emissions from the production of petrochemicals (non-energy products) are not included in the calculation of NCI.

The calculation accounts for all greenhouse gases in accordance with the GHG Protocol methodology.

The NCI and the GHG emission savings will be calculated based on the carbon footprint for the entire organisation for 2022, i.e., by the end of 2023.
  • 11.1.3

Energy consumption outside of the organisation
Steps will be taken to report the indicator in future years.

  • 11.1.4

Energy intensity

Read also:

Short-cuts:

ORLEN Group 2022 Integrated Report

You can also download the report in PDF format

Download pdf